

Introduction
We all know the significance of Databases and Analytics in a business operation. Many tools in the market help organisations make data processing seamless. Such a cloud-based tool is Databricks SQL Analytics.
Databricks SQL Analytics is a powerful tool for conducting extensive SQL data analysis. It offers a unified platform for processing big data, machine learning, and analytics.
Using the familiar SQL syntax, this tool enables users to perform complex data processing and analysis tasks simply, intuitively, and efficiently. Organisations can efficiently perform sophisticated data analysis and processing tasks with Databricks SQL Analytics, allowing them to gain insights into their data and make informed business decisions.
Databricks SQL Analytics is built on Apache Spark, which provides a robust and scalable processing engine. This blog will look at the key features and critical aspects of Databricks SQL Analytics and how to use it.
What is Databricks SQL Analytics?
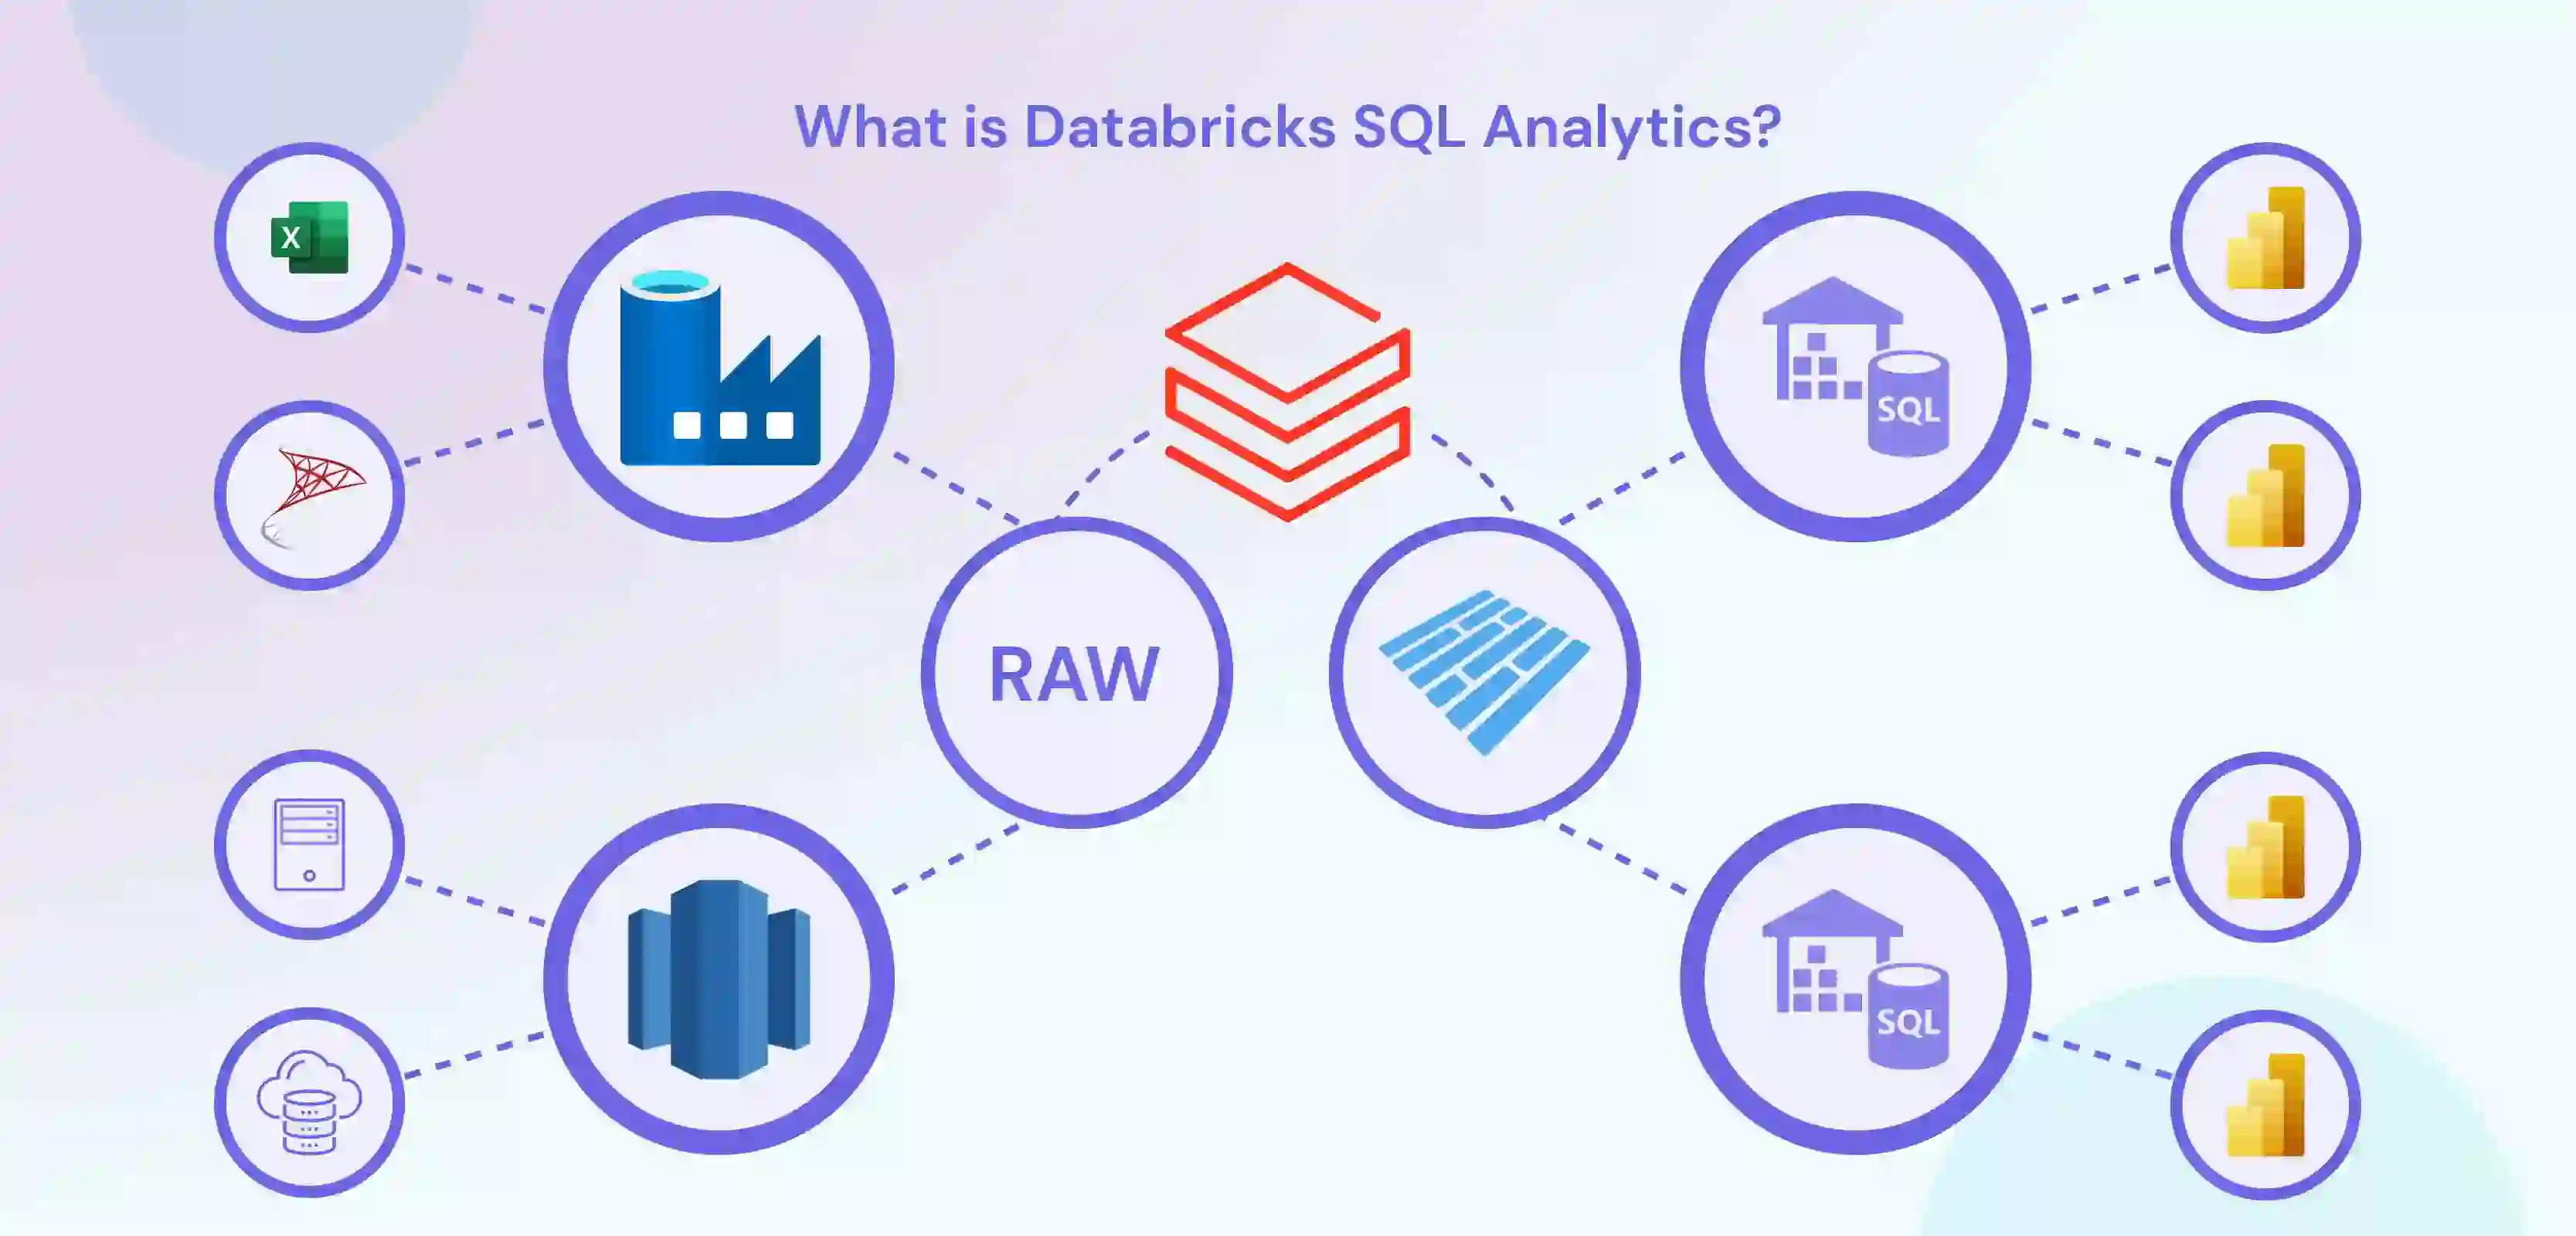
Organisations can use Databricks SQL Analytics to process, analyse, and visualise data using SQL. To help organisations understand their data and make strategic business decisions, Databricks Analytics offers a unified platform for big data processing, machine learning, and analytics.
Users of Databricks SQL Analytics can quickly and efficiently process and analyse large amounts of data without needing specialised technical expertise or in-depth knowledge of big data technologies. So nearly anybody with business knowledge can get their hands o it without worrying about technical expertise.
Apache Spark purely powers the magic of Databricks SQl at its processing. Well, as they say, 'Every prime has a core secret element behind it'; this analytics system can process enormous data sets because of its robust and scalable processing engine.
One of Databricks SQL Analytics' processes is fast, easy, and effective using the standard SQL syntax. It also offers several built-in functions and aggregations that let users or people process and analyse large amounts of data without needing advanced technical knowledge.
Several sophisticated features, including distributed data processing, real-time data streaming, machine learning, and more, are available with Databricks SQL Analytics.
Scalability is another hat the Databricks SQL Analytics wears. Organisations can quickly scale their data—processing and analysis operations with Databricks SQL Analytics.
Scalability comes to the rescue as their data needs increase without requiring extensive re-architecting or complex configuration changes. This technique of Databricks makes it perfect for businesses with ever-changing significant data processing requirements and those with quickly expanding data requirements.
In conclusion, Databricks SQL Analytics is a potent tool for big data analytics, giving businesses a unified platform for big data processing, machine learning, and analytics.
Whether a data analyst, data scientist or business analyst, Databricks SQL Analytics gives you the features and tools to handle challenging data processing and analysis tasks and discover insightful information about your data.
So Let's further look into various components of Databricks SQL Analytics and have a deeper understanding of this technology.
Critical aspects of Databricks SQL Analytics
The critical aspects of Databricks SQL Analytics include:
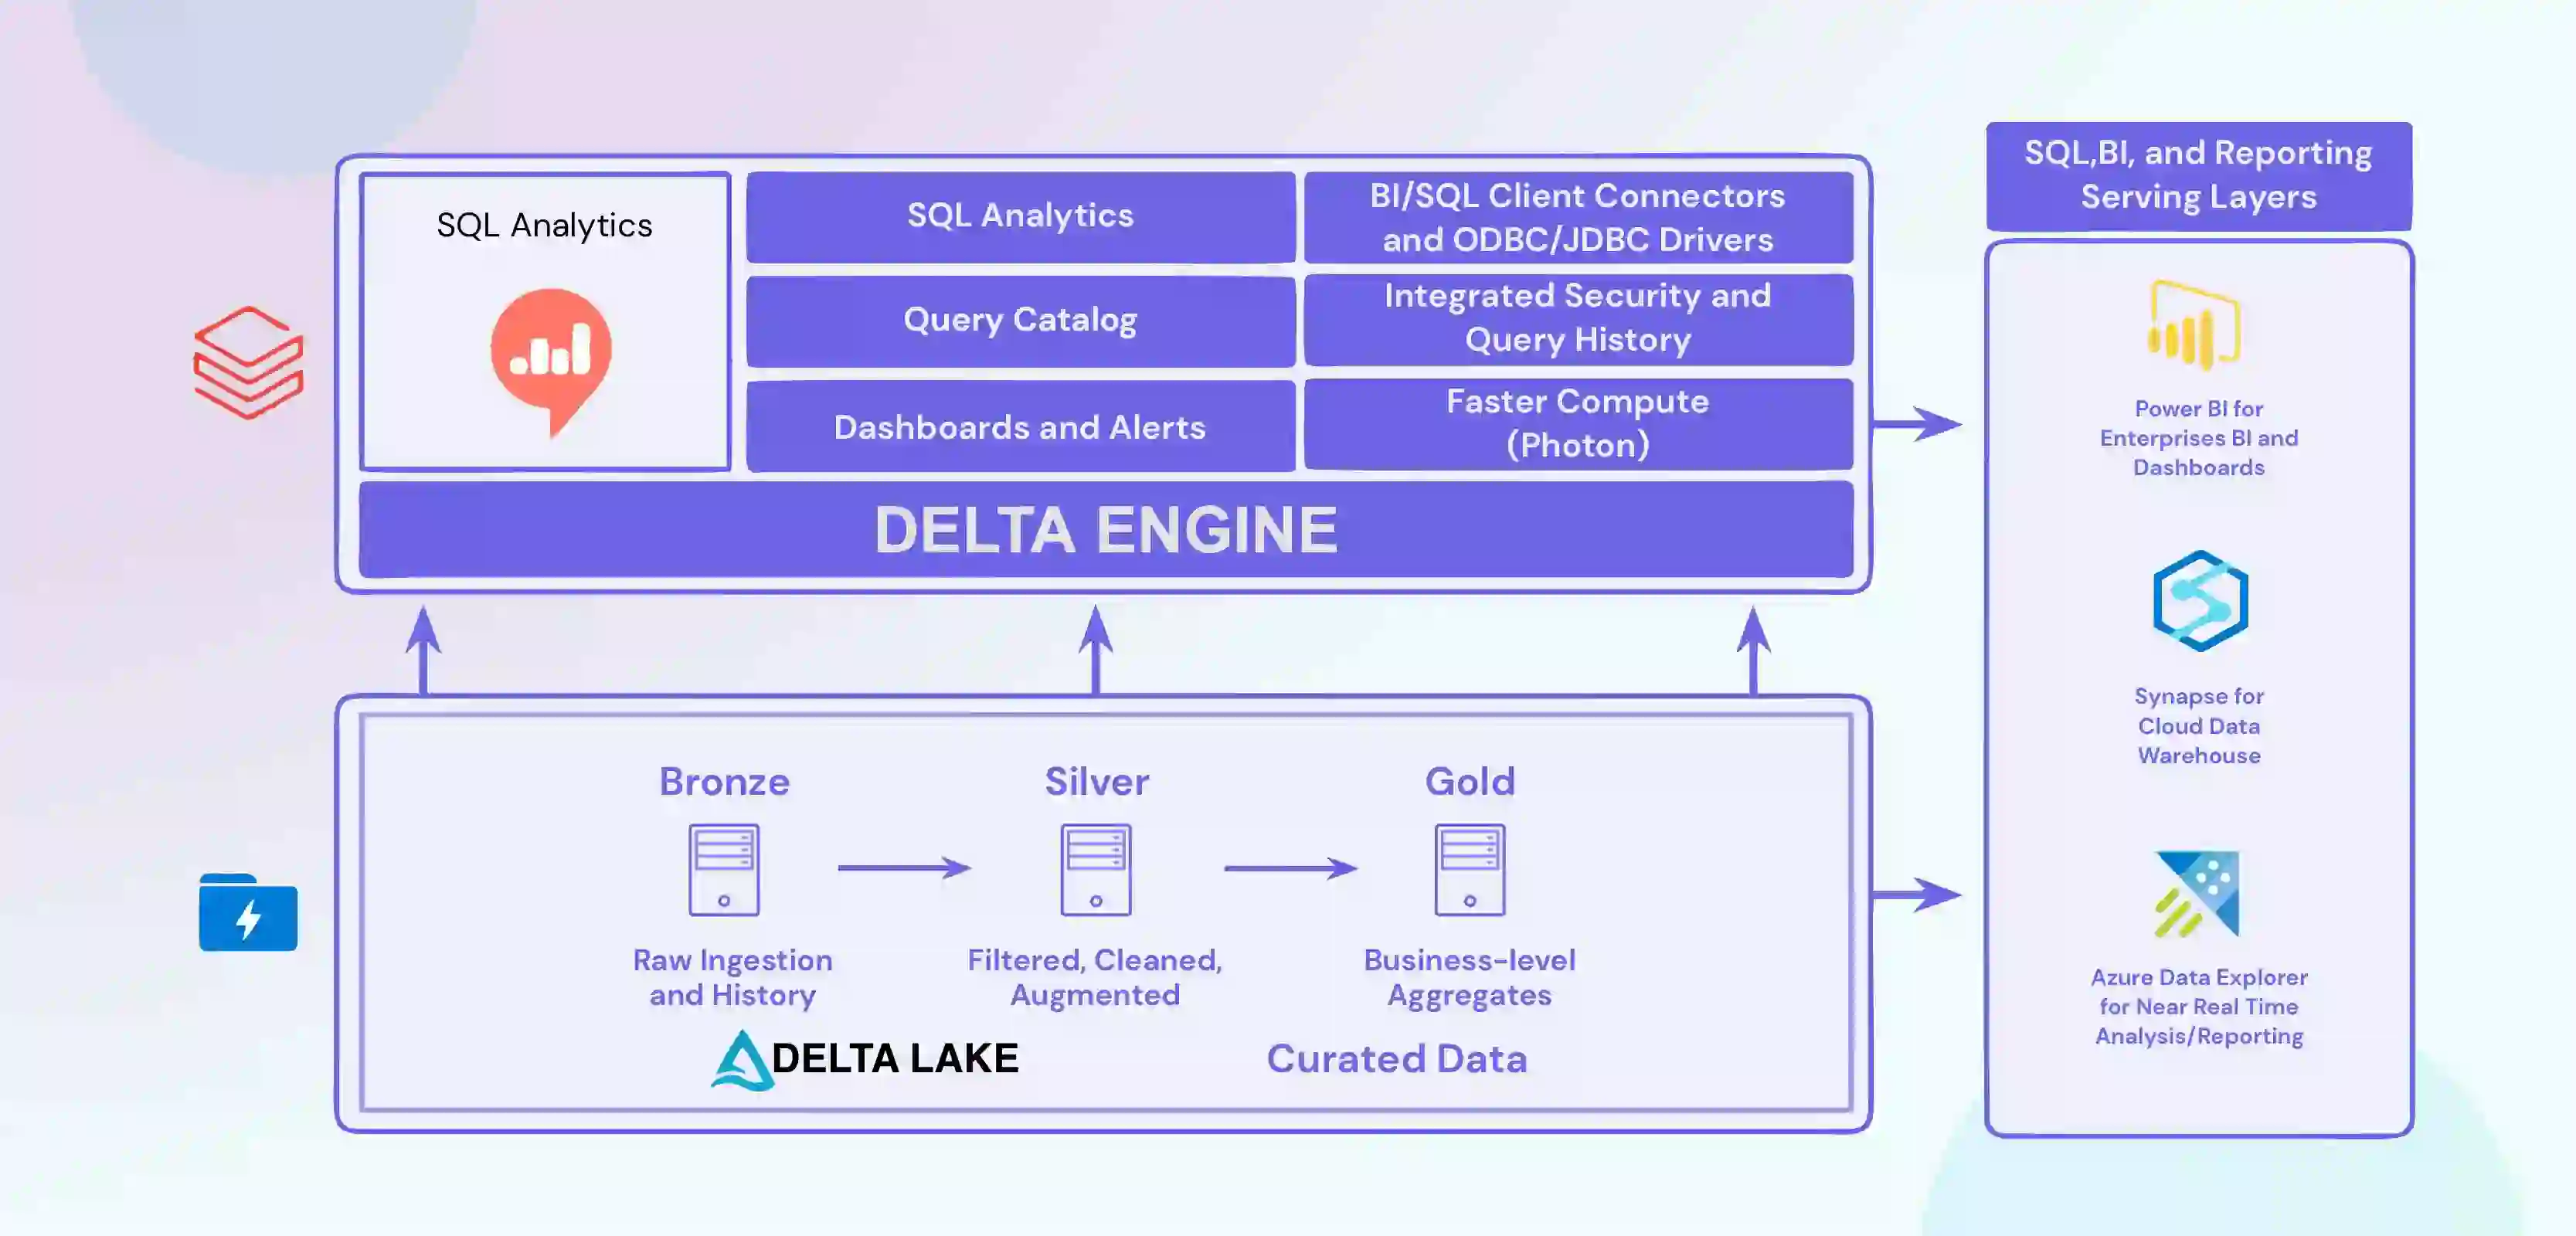
- Integration of the system with various data sources, including databases, data warehouses, and cloud storage platforms, to have a data flow pipeline until its final dashboard.
- Advanced data processing and analysis capabilities include real-time data streaming and machine learning.
- Scalability allows organisations to scale their data processing and analysis operations as their data needs grow.
- A user-friendly interface makes it easy for users of all skill levels to perform complex data processing and analysis tasks.
- A familiar SQL syntax allows users to perform complex data processing and analysis tasks simply, intuitively, and efficiently.
- These critical aspects of Databricks SQL Analytics make it a powerful tool for organisations looking to perform big data analytics and gain valuable insights into their data.
1) Run the First Query
Running your first query in Databricks SQL Analytics is easy. Log in to the Databricks platform and navigate the SQL Analytics interface. You can create a new question, select a data source, and run your first SQL query.
If you are familiar with SQL, the syntax will be regular to you, and you can start gaining insights into your data immediately. If you need assistance, Databricks provides extensive documentation and support resources to help you get started. So, go ahead and run your first query in Databricks SQL Analytics!
2) Creating a Query
Creating a query in Databricks SQL Analytics is a straightforward process. Navigate to the SQL Analytics interface and click the "New Query" button. Select the data source you want to query and write your SQL code. You can write your query in the editor, and once you are ready, click the "Run" button to execute the query.
Databricks SQL Analytics provides a user-friendly interface and a familiar SQL syntax, making it easy for users of all skill levels to create and run queries. So, start building your questions today!
3) Query Filters
Query filters are an essential aspect of Databricks SQL Analytics. They allow you to narrow down the data you are analysing and focus on the most relevant information to your needs.
To create a filter in Databricks SQL Analytics, you must add a WHERE clause to your query. For example, if you wanted to see data only for a specific date range, you could write a question like this: "SELECT * FROM table WHERE date BETWEEN '2022-01-01' AND '2022-12-31'".
Filters allow you to quickly and easily find the information you need to make informed decisions.
4) Query Parameters
Query parameters in Databricks SQL Analytics provide a way to make your queries more flexible and reusable. Using parameters, you can create a question that can run with different values without modifying the underlying code.
You can create a query with different values without changing the underlying code. To create a parameter, specify a placeholder. For example, instead of hard-coding a date range in your query, you could create a parameter for the start date and another for the end date and then supply those values when you run the query.
Query parameters make running the same question multiple times with different inputs easy, saving you time and effort.
5) Query Snippets
Query snippets in Databricks SQL Analytics are pre-written code inserted into your queries to save time and effort. Query snippets can include commonly used SQL statements, functions, or complete questions.
To use a query snippet, navigate to the SQL Analytics interface and select the "Query Snippets" option. From there, you can browse the available snippets and choose the one you want to use. The selected snippet will then insert into your query, where you can modify it as needed.
Query snippets are a great way to save time and simplify the query writing process and are especially useful for users new to SQL or the Databricks platform.
SQL Analytics Visualisations in Databricks
Databricks SQL Analytics provides:
- A powerful and flexible platform for data visualisation.
- Ability to allow users to create charts easily.
- Graphs.
- Other visual representations of their data.
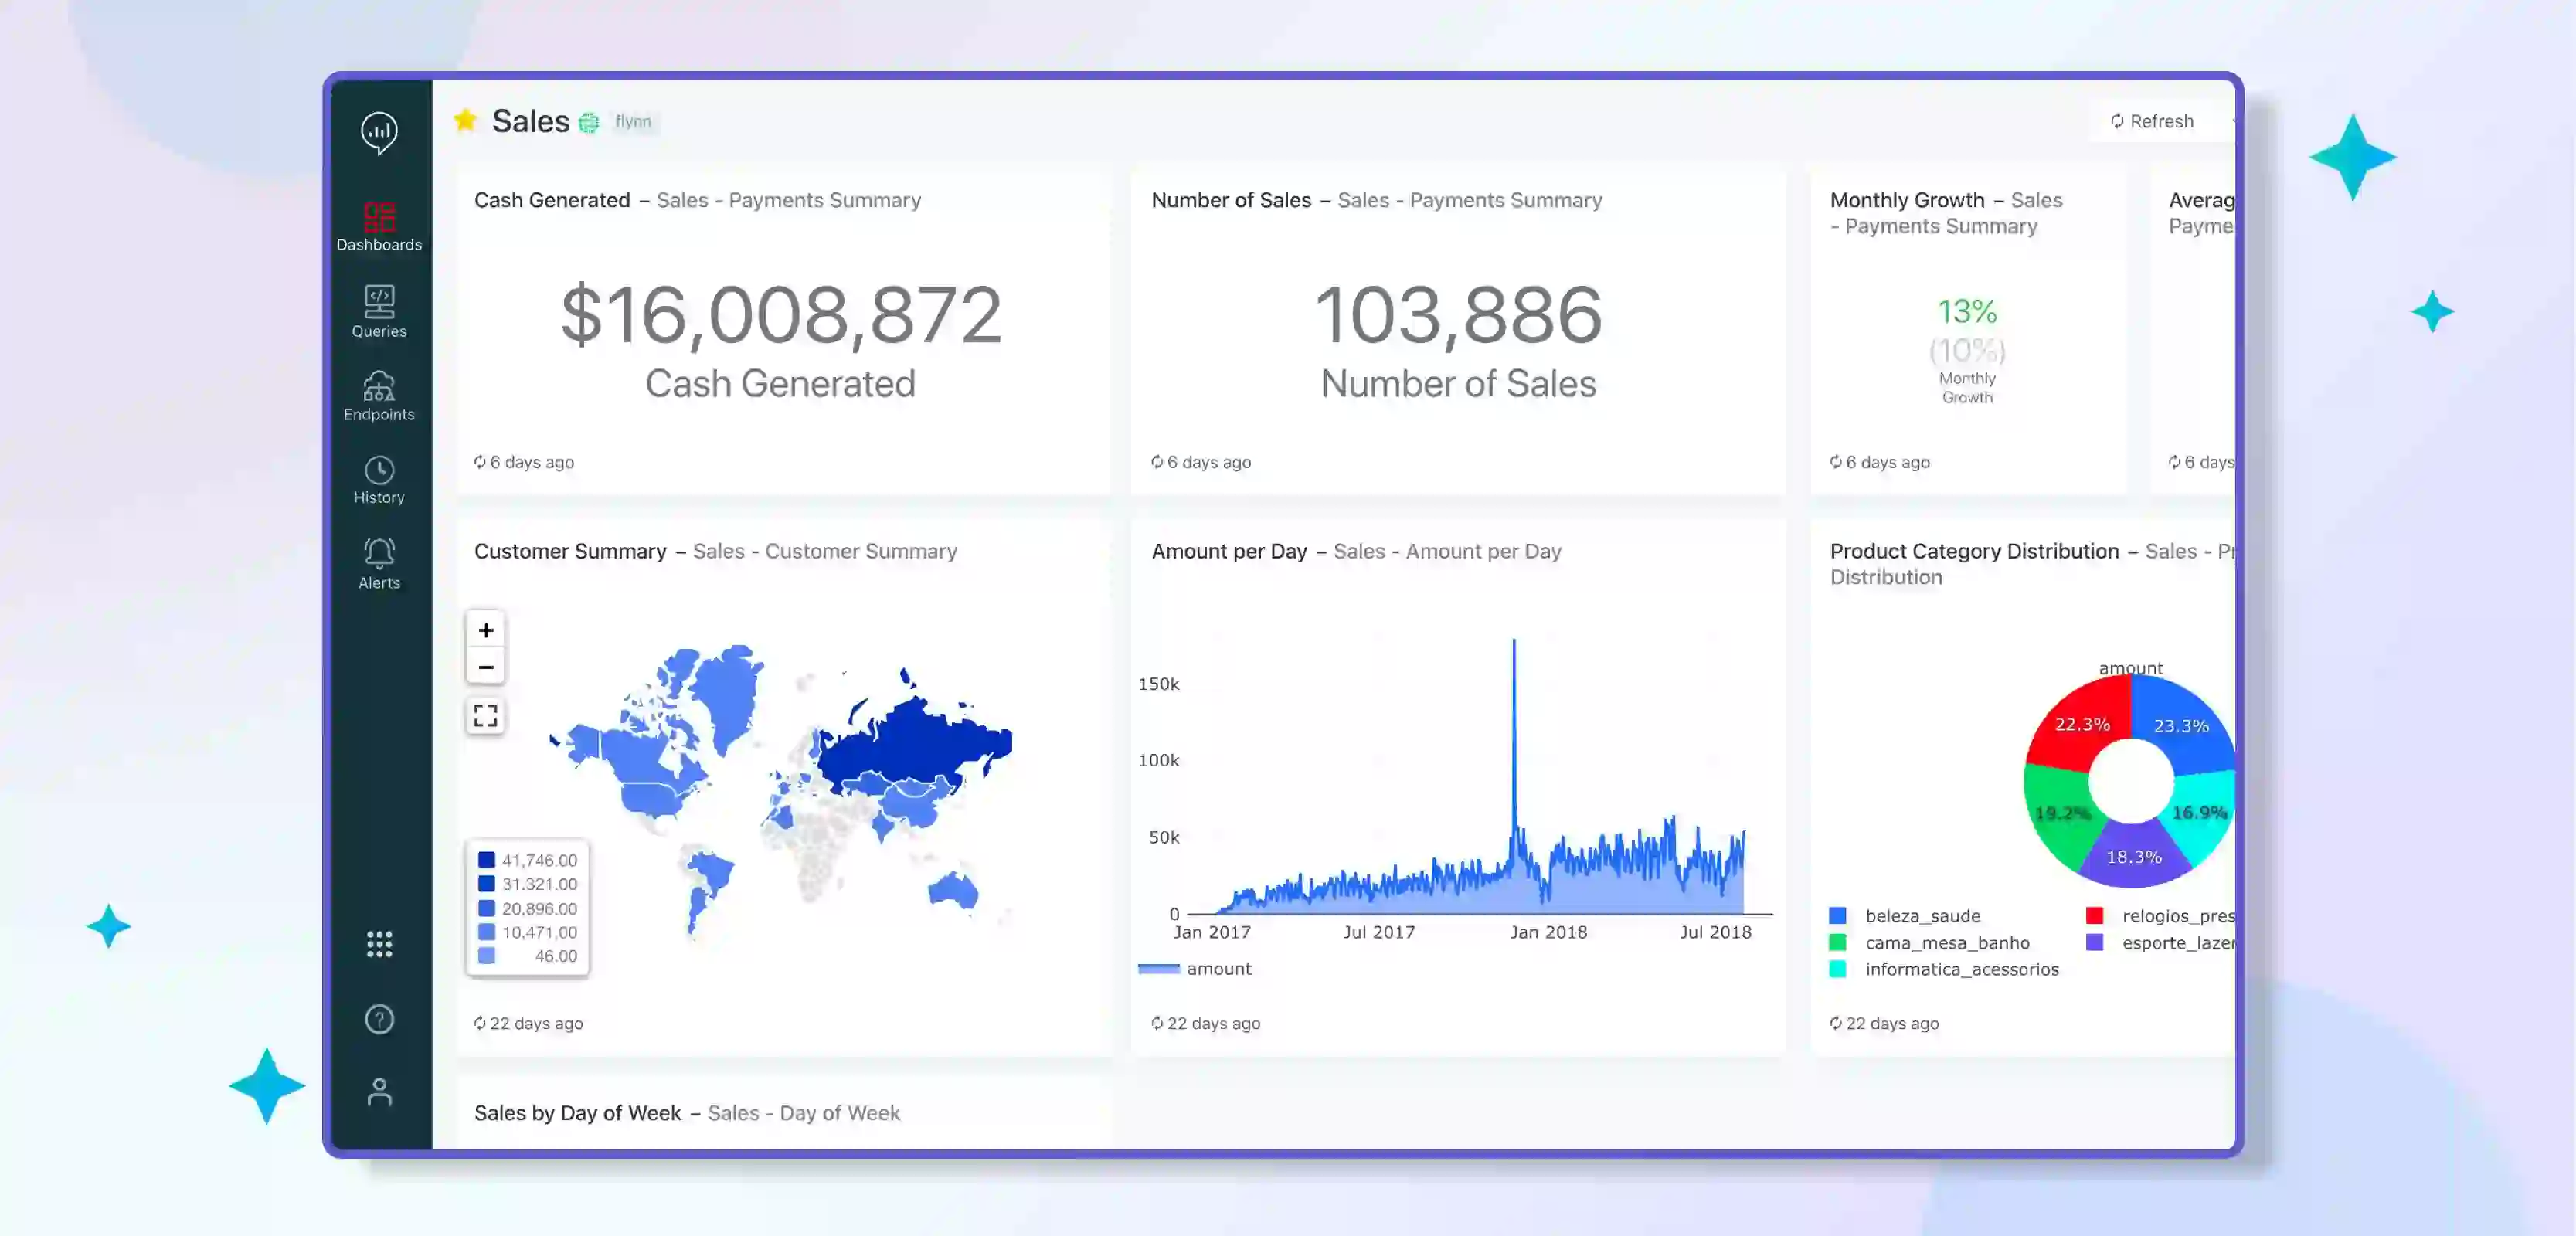
With a wide range of visualisation options, Databricks SQL Analytics makes it easy for users to gain insights from their data and make informed decisions.
One of the critical benefits of Databricks SQL Analytics is its integration with other visualisation tools, such as Tableau and PowerBI. This benefit allows users to take advantage of the rich visualisation capabilities of these tools while still using Databricks as the underlying data source.
Additionally, Databricks provides a built-in visualisation tool that makes it easy to create charts and graphs directly within the platform.
The bar chart is one of the most popular visualisations in Databricks SQL Analytics. Bar charts are commonly used to represent categorical data and to compare data across categories.
In Databricks, users can create bar charts with a few clicks and easily customise the chart's appearance by changing colours, labels, and other formatting options.
Another common type of visualisation in Databricks SQL Analytics is the line chart. Line charts commonly represent time-series data, such as stock prices or weather data.
In Databricks, users can create line charts by selecting a date or time field, and the platform automatically generates a chart that represents the data over time.
Scatter plots are another popular visualisation type in Databricks SQL Analytics. Scatter plots are commonly used to represent the relationship between two variables and identify data patterns.
In Databricks, users can easily create scatter plots by selecting two fields from their data, and the platform will generate a chart representing the relationship between the two variables.
Pie charts are another popular visualisation type in Databricks SQL Analytics. Pie charts are commonly used to represent data distribution and compare data across categories.
In Databricks, users can easily create pie charts by selecting a field from their data. The platform will automatically generate a chart representing data distribution across categories.
In addition to these basic visualisation types, Databricks SQL Analytics provides advanced visualisation options, such as heat maps and histograms.
Heat maps are commonly used to represent data distribution across two dimensions and identify data patterns. In Databricks, users can create heat maps by selecting two fields from their data. The platform automatically generates a chart representing data distribution across the two dimensions.
Histograms are commonly used to represent data distribution across a single dimension. In Databricks, users can easily create histograms by selecting a field from their data. The platform automatically generates a chart representing data distribution across the specified dimension.
Finally, Databricks SQL Analytics provides various customisation options, allowing users to fine-tune their visualisations to meet their needs. For example, users can change the colours of their charts, add labels and annotations, and even change the data aggregations used in their visualisations.
To sum it up, Databricks SQL Analytics provides a powerful and flexible platform for data visualisation, making it easy for users to gain insights from their data and make informed decisions.
With its integration with other visualisation tools, built-in visualisation tools, and advanced visualisation options, Databricks SQL Analytics is an excellent choice for data professionals looking to visualise their data.
Performance Optimisation
Performance optimisation is critical to Databricks SQL Analytics, ensuring that queries run quickly and efficiently. Several strategies can be used to optimise the performance of SQL queries in Databricks.

1. Indexing:
Indexing is a database optimisation technique that speeds up the query processing time. In Databricks, indexes can be created on specific columns or tables to speed up the query execution time.
2. Partitioning:
Partitioning is another optimisation technique in which large datasets are divided into smaller, more manageable units. In Databricks, you can partition data by time, key, or both, to speed up query execution time.
3. Compression:
Compression is a technique for reducing the size of data stored in a database. Compression reduces the size of the data stored on disk, reducing the time required to read the data from disk. In Databricks, you can use various compression techniques such as Snappy, Zlib, and LZO to optimise performance.
4. Caching:
Caching is a technique that stores frequently used data in memory for faster access. In Databricks, you can cache tables to improve query performance, especially for frequently used queries.
5. Materialised Views:
Materialised views are precomputed tables that can be used to speed up the query execution time in Databricks SQL Analytics. Materialised views can be created in Databricks and refreshed on a schedule or demand.
Query optimisation is making changes to a query to improve its performance. In Databricks, you can optimise queries using indexes, partitioning, compression, and other techniques.
6. Data Skew:
Data skew occurs when a small number of rows in a large dataset dominate the query processing time. In Databricks, you can address data skew using bucketing, partitioning, and sampling techniques.
So, performance optimisation is critical to the success of any SQL analytics platform, and Databricks provides a range of tools and techniques to help optimise performance. Whether you're working with large datasets or complex queries, it's essential to keep performance optimisation in mind to ensure your SQL analytics run quickly and efficiently.
Conclusion
Databricks SQL Analytics is a powerful tool for analysing and processing large amounts of data in real time. With its ability to run SQL queries, create and manage databases, and perform advanced analytics, Databricks SQL Analytics is an essential tool for data scientists and engineers.
The critical aspects of Databricks SQL Analytics, such as running queries, creating filters, and using query parameters, make it a versatile and flexible platform for managing data.
Performance optimisation strategies, such as indexing, partitioning, compression, caching, materialised views, and query optimization, help ensure that Databricks SQL Analytics can run quickly and efficiently.
drives valuable insights
Organize your big data operations with a free forever plan
An agentic platform revolutionizing workflow management and automation through AI-driven solutions. It enables seamless tool integration, real-time decision-making, and enhanced productivity
Here’s what we do in the meeting:
- Experience Fynd Boltic's features firsthand.
- Learn how to automate your data workflows.
- Get answers to your specific questions.